-

-
Challenge
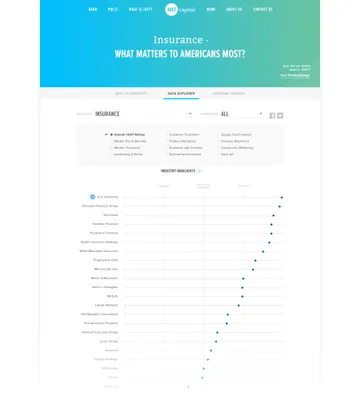
Create a compelling experience that allows companies and consumers to understand and explore JUST Capital’s corporate rankings.
-
Solution
Use robust JavaScript frameworks to present JUST Capital’s rigorous dataset in a transparent, interactive visualization.
-
Results
A unique and engaging visualization system that clearly highlights top-ranked companies and encourages deep exploration.
Corporate ethics matter. To that end, JUST Capital evaluated the performance of over 900 public companies on the issues Americans care most about. After months of research and number-crunching, JUST Capital collaborated with Viget to unveil their results to the world. We leveraged powerful JavaScript frameworks to deliver a custom interactive visualization that highlights top performers in each industry and inspires users to explore the data for themselves.
Areas of Expertise
-
-
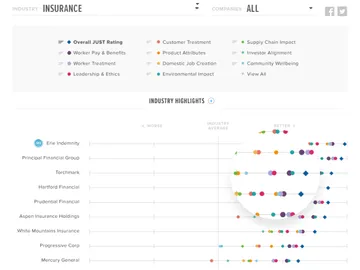
Skimming or Deep Diving Into Content
Our visualization standardizes JUST Capital's underlying data, enabling users to compare companies across multiple categories. We balanced the wealth of content through carefully designed, delightful interactions and hovers that make deep exploration easy without ever feeling overwhelming.
-
-
-
This video has no audio
-
Living in SquareSpace
Using React to render the application made it easy to embed the visualization in JUST Capital’s existing SquareSpace site and follow the user as they explored the app, allowing for easy shareability.
-
Keeping Data Up to Date was a Dream
We used the latest version of Microcosm, our data management library for React to keep things organized. Bringing in Nightmare allowed us to efficiently write complicated tests and verify the correctness of our data. Consistent quality across data updates and Squarespace integrations: covered.
Acceptance Testing React Apps with Jest and NightmareNate Hunzaker, Former Development Director
-
-


Summary
Our collaboration with JUST Capital resulted in a unique and engaging interactive visualization that highlights top-ranked companies and inspires users to explore the data for themselves.