-

-
Challenge
Translating complicated and dense investment charts and strategies from a traditional paper medium to the web.
-
Solution
A highly interactive, engaging, and performant web application with world class data visualizations and UI.
-
Results
The application’s page has quickly become one of the most-visited parts of Research Affiliates’ site, and was featured on Bloomberg.com.
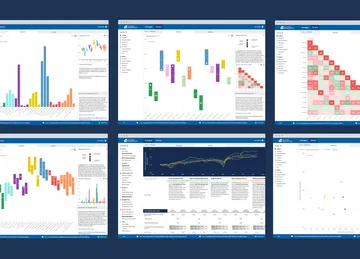
Investment strategies never looked so good. With a revamped brand and newly launched site experience, Research Affiliates was in search of a partner to help productize their investment strategies into a rich, interactive web application. Partnering with Research Affiliates’ in-house team, we created a highly sophisticated React app to visualize complex investment data in a brand new product that presents unbiased strategies for investors.
-
-
-
-
Design by Prototype
Early access to data allowed us to design with real-world scenarios in mind. We leveraged Tableau to quickly assess chart types and dashboard interactions before committing development time.
-
This video has no audio
-
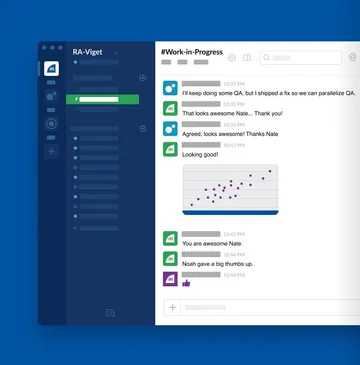
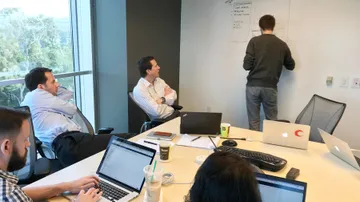
Real-Time Collaboration
Acting as an extension of their team, we collaborated closely via stand-ups and Slack to share .gifs of the rapid prototypes we created for our proposed new features. This, combined with shared Google docs of our notes, allowed for maximum transparency, efficiency, and live feedback throughout the engagement.
-
-
-
-
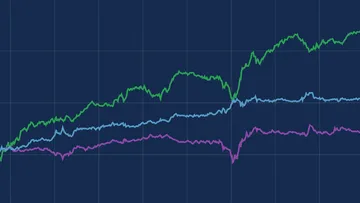
React + D3
Leveraging React, we were able to define components and render HTML and SVG while utilizing D3 for computations to create data visualizations on the fly. This powerful combination of tools allowed us to build a scalable component library for this intensive data visualization effort.
-
This video has no audio
-
-
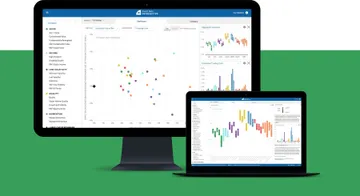
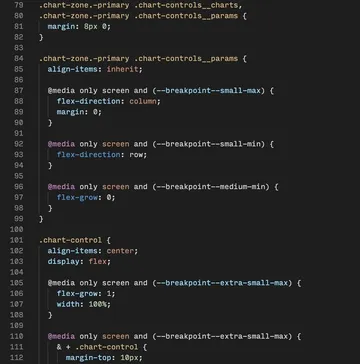
Responsive Charts
We crafted a front-end experience that would respond to the wide options of widths and heights. Using good old-fashioned math skills, we wrote algorithms to stress-test the edge cases of the data to ensure the visual display was fully accounted for.
-
This video has no audio
-