-

-
Challenge
Catalist needed a way to help their users make sense of a vast trove of political ad data.
-
Solution
Develop an MVP to get data analysis tools in real user hands quickly and iterate based on their feedback.
-
Results
A suite of user-friendly tools that allow for customized, granular data analysis.
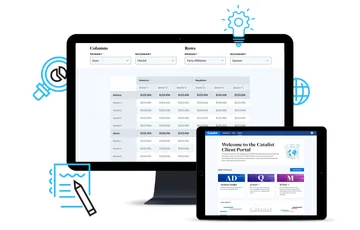
Data, Data, Everywhere. In the era of Big Data, many organizations struggle to turn their treasure trove of information into digestible, useful knowledge. Catalist had a head start. As a company who collects and curates political data for their clients to use in their programs, Catalist was already leveraging Tableau to create different types of ad data visualizations. However, there were some visualization methods that Tableau couldn’t fully support and they were limited to processing smaller datasets. We built a suite of new, user-friendly custom tools to allow for more advanced visualization approaches driven by a larger dataset of historical ad data.
Areas of Expertise
-
-
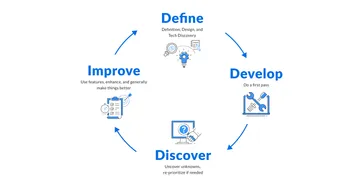
Start Small to Grow Big
To turn that mountain of data into something meaningful, we took an MVP approach. Our developers built an application using Python + Django that could perform the needed analyses starting with a small data set focused on the current election cycle. Once built, we began scaling up. Over the course of the project we went from processing 100 rows of current ad data to 34 million rows of historical ad data going back to 2010. With each iteration our team improved the load times for data-filtering and generating custom reports. Eventually, we finalized two tools: the current Ad Data Analyzer and the Historical Ad Data Analyzer. These tools, which can pull information for current political ads and compare political ad trends from the past decade, offer users the ability to compare data on both a macro and a micro scale.
-
-
34 million
rows of historical ad data processed
-
This video has no audio
-
The Devil’s in the Details
User research was vital in driving the nuances of the experience, from the display of incredibly dense data, to fine-tuned filters, to slicing, aggregating, and hiding data where appropriate. Our research also illuminated a different persona: one who might not complete in-depth political data analysis, but did need to stay informed when new political ads were released. To help Catalist meet this need, we developed an email alerts feature that enabled users to be notified any time a new ad dropped. We again started with an MVP version of this feature, and then iterated from there to build more advanced, customizable notification settings. Users could move beyond just choosing to receive all alerts about new ads, to being able to select one or more states, issues, or campaigns to track, silence them during off-cycles, and stay informed about only about the ads that were relevant to them.
-
-
-
This video has no audio
-
"We came to Viget with a sprawling, multi-faceted idea for a new tool for our clients. They were exceptional partners, working closely with us to help focus, clarify, and prioritize our complex requirements. They developed a product that looks and functions beautifully. We're thrilled with the result."

Summary
Taking an MVP approach, we developed a suite of user-friendly tools that processed Catalist’s massive dataset into an easy-to-analyze format. This gave their users valuable insights that allowed them to be more competitive in the political arena.