Measure, Monitor, Repeat: Web Performance Tools

Doug Avery, Former Senior Developer
Article Categories:
Posted on
Find the right performance assessments, metrics, and techniques for your web business.
At Viget, we're dedicated to building sites that load fast and stay fast. This begins by following performance best practices on day one, but that's only half the challenge — how do you identify and fix performance issues that arise as a site grows? My last article on the topic was a company-level overview: Measurement, best practices, and how to target high-value areas of your site for improvement.
This post is a deeper look at one of those topics: How to measure and monitor site performance. There are numerous techniques and tools to explore, but it's not always clear which one is the best for your problem — I'll go over a few options and help narrow down the choices. But first...
What are we measuring?
Performance measurement begins by tracking readily-available, universal values that matter on any site. The deeper into measurement you go, the more custom this tracking becomes:
- How much data do users load on the first visit? (Easy, tracked in nearly any tool)
- How long do users wait until key content is interactive?
- How much faster is a user's second visit?
- How long do users wait for key API requests?
- How quickly can users complete a key flow? (Hard, requires custom measurement)
You’re looking for a tool with a mix of characteristics: Good insights, strong customizability, options for deeper integrations down the road. The three big ones:
The Baseline: Lighthouse
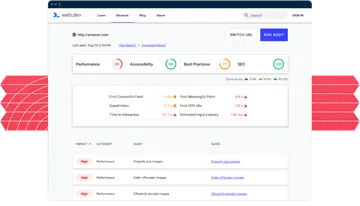
Lighthouse is Google's automated tool for evaluating web performance. It's rock-solid, and provides both immediate value and opportunities for long-term improvements. If you're just starting your measurement journey, start with Lighthouse. A few ways to use it:
1. On the web via PageSpeed Insights
A hosted version of Lighthouse that runs one test on mobile, one test on desktop. This method is great for testing marketing pages, and since it tests from a central location, you may get more consistent/realistic results than you would running a Lighthouse test locally. The biggest drawback is that you can't use it for any pages that aren't publicly accessible.
2. In the Chrome developer console
Still really accessible, but runs inside your console, so you can use it for any site accessible via Chrome. (Note that this will use your local network — work with the throttling feature to get consistent results when testing on different networks/devices).
3. On the command line
Using the node CLI, Lighthouse can be run anywhere and export data as a JSON file. The node CLI can run headless Chrome, enforce performance budgets, and even test on a USB-connected Android device. Learn more on GitHub.
Using Lighthouse this way opens a few doors: You can write scripts that test performance on an entire flow, incorporate Lighthouse checks into your CI, or even roll your own monitoring service (more on this later).
Pros:
- Fast, accessible, and lightweight.
- Nicely summarizes data, and does a good job of prioritizing issues.
- Goes beyond basic load time stats you'll see elsewhere, exposing derived stats like Speed Index and Time to Interactive.
- Educates developers about some of the complex aspects of web performance.
Cons:
- Missing some high-powered features from other services: Built-in scripting, multi-page crawling, asset blocking.
- Obscures some deeper information (like waterfall views) in favor of a user-friendly UI.
- Requires choosing to either use your own local network (which may be inconsistent) or sacrificing some power to test from a central server.
More flexibility: Sitespeed.io
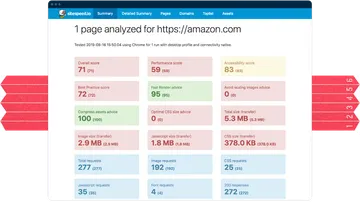
Sitespeed.io is an open source suite of performance measurement tools that run directly from the command line. While it's designed for monitoring, it's also a great tool for generating detailed performance reports. Sitespeed's docs are A+, I suggest skimming them even if you end up picking another solution.
Try a quick demo with npm install -g sitespeed.io, then sitespeed.io https://amazon.com --html.showAllWaterfallSummary -n 1 --outputFolder results. Open the index.html file in ./results to check out the output.
Pros:
- Fast, feature-rich, flexible.
- Easy to configure features like screenshot recording and automated crawling.
- HTML reports are great for sharing and reviewing performance data.
- Built to work with modern tools like Slack, Grafana, and even other performance tools like Lighthouse and WebPageTest.
- Solid, well-documented features like scripting.
- Built with monitoring in mind, and when you get to that step, has a simple setup for hosting your own dashboard (example).
Cons:
- With no web-hosted option, Sitespeed isn’t as simple to just run a quick tests with — using it requires some technical knowledge and setup.
- Lighthouse and WebPageTest can test from a central, consistent network. Sitespeed can't do this right out of the box, but has some great docs on mitigating this issue with throttling.
More power: WebPageTest
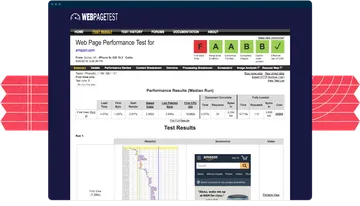
If you're looking for the gold standard in performance measurement, check out WebPageTest. It may not have the slickest UI, but makes up for it:
Pros:
- Easily runs multiple tests and averages results; can test "repeat views" to verify caching.
- Provides a huge amount of data: Main thread breakdowns, request waterfalls, and per-request data, Last Painted Hero.
- Automatically stores test runs at URLs for later review.
- Huge number of locations to test from, ensuring consistent results between tests.
- Can test multiple browsers, including IE11, Edge, and Firefox.
- Server location, browser, asset blocking, and scripting are all configurable from the web app — no local installation required.
- Provides the option to set up a private instance for more advanced monitoring.
Cons:
- Typically slower than other web-based tools.
- Test locations/devices require that you select the most realistic option for your test, and remember to use the same location on future tests.
- Test output is much more technical, and possibly more confusing. You need to parse some of it yourself to identify meaningful metrics.
- Much trickier to run tests against a page on a local network.
- Big, long-running library with a lot of history and quirks to learn.
WebPageTest is my go-to "what's up with this page?" tool — it’s a great mix of configurability, power, and convenience. Being able to script, test across browsers, and block assets is invaluable for hunting down tricky performance problems.
Monitoring
Now that you've measured your performance with a few tests, it's time to monitor that performance. There are two types of data to think about collecting:

Lab data
So far, I’ve been talking about "lab data" — data you collect in a controlled environment, the same way, every time. This means regularly running measurements on your site and recording the output. For granular, day-by-day data, you'll want to run measurements on some kind of hosted service, and record it somewhere you can visualize it.
All three tools mentioned above can be configured for monitoring (sitespeed.io especially), but come with the overhead of more work/more services/more costs to worry about. Some hosted services, like Calibre, SpeedCurve, and Pingdom, can provide monitoring with less setup — but the data they collect may not fit your exact needs.
If you're just starting out, automation can be overkill — if weekly data collection is good enough for you, you can write a basic local script that dumps data into a spreadsheet or visualizer. This will give you insight into performance over time with much lower setup overhead.

Field data
AKA "real user monitoring" (or RUM), field data comes from the actual users on your website (Google has a good doc on the distinction). This data is a double-edged sword — it can expose major holes in your performance, but can also create noise and distraction for a team.
Example:
If a roomful of conference attendees hears about your product and opens the site on the slow wifi, your data may show a scary-looking performance spike, even though a) your site is no slower than usual, and b) the exposure you're getting is a good thing, not a crisis. Remember to view field data in aggregate, not little slices.
For typical websites, baseline RUM may be already enabled in your tools — GA automatically collects this data on the Behavior > Site Speed screen, and New Relic records it in the Browser section (Note: For GA, you may want to increase the 1% sample rate). You can also look for field data in the Chrome UX Report, Google’s public dataset of performance timing across Chrome users.
If your site has more SPA-like features, auto-collected field data won't cut it — users load data and perceive speed differently in an SPA, so initial load time can be much less important to your business. To tune your monitoring, you'll need to track user timing on key interactions.
Example:
If you have a key graph on your dashboard, you might want to know how long it takes most users to actually see the data. Use performance.mark to mark the first dashboard view, then performance.measure when the chart finishes rendering. Once you have timing details, save them somewhere (example docs from GA).
A measurement like the one in my example may seem silly — can't you just monitor the API response time for the graph? — but exposes other issues that may be affecting performance. Maybe the API is fast, but other work on the screen causes a 2-second delay before the user sees the data. Maybe the graph library is simply too slow for your needs, requiring a replacement. These timings can be difficult to get right, and costly to debug after a release, so start small by picking key interactions to instrument.

Go forth and measure!
Now that you have the tools, you're ready to start measuring performance in development, monitoring it regularly, and tracking real user metrics for further insight. For a higher-level look at retooling performance for your web app, check out our post on the process.
If you're looking for a partner to help speed up your site, let us know! Viget’s been building fast websites for almost 20 years, and we’d love to answer your performance questions.