Track Visitor Retention More Deeply in Google Analytics
Paul Koch, Former Data & Analytics Director
Article Category:
Posted on
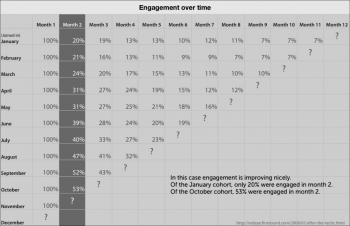
Recently Todd Moy, a member of our UX team, shared a cohort analysis chart, which illustrates whether a website is retaining its users and if it’s improving over time. Cohort analysis is an easy way to visualize your site’s addict-ability.
In this post, I’ll describe the best way, as far as I know, to use Google Analytics to get the necessary info for a cohort analysis.
In the chart below (roll over for larger image), you can see that the example site becomes more useful to new users over time: only 20% of January’s first-time visitors came back in February, but 39% of June’s first-time visitors came back in July, and 53% of October’s first-timers came back in November. The site is improving.
 (Source)
Google Analytics *kind of* gives you information about visitor retention through the New vs. Returning visitors report, which shows you the proportion of returning visitors. You could set your date range for January, note the percentage of returning visitors, and then set the date range for February, hoping that the percentage of returning visitors has increased.
But what happens if you retain all your January visitors, but drive a ton of new visitors to the site in February? Your proportion of returning-to-new visitors will go down even though you’re retaining visitors.
You can use GA’s custom variables to work around this problem and get the info to make your own cohort chart. Caveats: 1) you can only track 5 months (or weeks, or whatever time unit you want) at a time and 2) you’ll max out custom variable capacity in GA, so this method is ideally for sites that don’t need custom variables to track anything else.
Let’s say we want to track visitor retention each month, starting in August.
Step 1: Call the _setCustomVar method right before the _trackPageview() method:
pageTracker._setCustomVar(
1,
"Month",
"August 2010",
1
);
pageTracker._trackPageview();
The first “1” is your slot, which you will change each month (2 for September, 3 for October, etc.) If you want to track visitors who come in January (month 6), then you’ll be back at Slot 1 again and the August visitor variable will be over-written. The second “1” sets the scope to visitor-level, as opposed to page- or session-level. For more nuts and bolts about custom variables, check out this Google Code page.
Step 2: On September 1, you’ll need to alter the code on your site. Simply change the Slot number and the name of the month:
pageTracker._setCustomVar(
2,
"Month",
"September 2010",
1
);
pageTracker._trackPageview();
Step 3: When you have enough data to make your chart, view the Custom Variables Visitor report in GA. If it’s the end of October, then set the date range to October and see how many visits you got from the August and September custom variables. Then change the date range to September, and spend 5 minutes populating your own chart in Excel!
This blog post provides a blank Excel cohort template, and this blog describes really well why you’d want to do cohort analysis in the first place. If you have any more streamlined tips for measuring retention, please share them in the comments!
(PS: If you're interested in learning more about GA, check out our training session at Viget on September 23!)