"Should we upgrade to GA 360?"
Paul Koch, Former Data & Analytics Director
Article Categories:
Posted on
Organizations often evaluate GA 360 when they encounter these pain points within the free version of Google Analytics.
Google Analytics 360 is a powerful tool for better optimizing your ad spend, applying data science techniques to your clickstream data, and more quickly analyzing unsampled data within your GA reports.
While GA 360 is often touted as an “enterprise tool,” not all large enterprises are ready for it — and, on the flipside, many companies who derive major value from GA 360 aren’t large enterprises. This article describes what to consider as you decide whether you should upgrade.
Hurdles in the free version of Google Analytics
Organizations often evaluate GA 360 when they encounter these pain points within the free version of Google Analytics:
Sampling
Google’s standard reports — such as “All Pages,” “Source/Medium,” or most other default reports — provide unsampled, pre-aggregated data until you make an ad hoc query of that data. An ad hoc query includes applying a:
- Secondary Dimension, which adds a new column to the table (e.g., “Show my top pages broken down by device type”).
- Segment, which shows reports only for a subset of users or sessions that meet particular conditions (e.g., “Show my top pages, but only for sessions that completed a transaction”).
- Custom Report, which lets you build your own unique combinations of metrics and dimension drilldowns.
Google Analytics samples data any time a date range includes more than 500,000 sessions for the web property (UA-XXXX-Y number). If you see a notification like this:
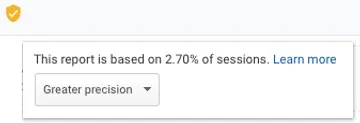
then it means that Google Analytics is evaluating 2.7% of all sessions, and then estimating the remaining 97.3%. The smaller your sampling percentage, the less accurate the data will be. It’s possible that comparisons of time periods won’t even be directionally accurate, depending on the sampling level.
Some organizations pull multiple date ranges of data, then sum the numbers together, to remain below the 500,000-session sampling threshold. There are even tools such as Supermetrics and Unsampler, which automate this process.
While these tools have their place (we love and use Supermetrics in certain instances), this approach can slow down data analysis because it requires data queries to be made outside of GA. This unsampling approach also requires more internal education for multiple users and departments who may already know how to use the GA interface to get their data.
Incomplete advertising data
While free Google Analytics has a fantastic out-of-the-box integration with Google Ads, it doesn’t integrate with Campaign Manager, Display & Video 360, or Search Ads 360 (formerly called DoubleClick Campaign Manager, Bid Manager, and Search).
As a result, free GA users lack visibility into — for example — how traffic and conversions were influenced by views of display ads that people didn’t click, but that sparked people to seek out the website in a future session.
Effective advertising programs use attribution models that factor in all the inbound touchpoints that precede a conversion — and then move budget to the channels that drive outcomes most cost-effectively. When some of your advertising cost and conversion data resides in different systems, there are barriers to deduplicating that data and making effective comparisons across channel types.
Inability to use your existing historic data for data science applications
You’ve likely already invested in setting up extensive interaction and conversion tracking on your website. You also probably have a CRM containing offline data about your leads, subscribers, and customers. Now, you want to understand questions such as:
- What inbound sources lead to our most profitable long-term users?
- What on-site behavioral patterns or user attributes keep people renewing as customers?
- How much time elapses between when people take one action (e.g., sign up for email updates or a free trial) and another (e.g., complete a purchase or upgrade)? What are the drivers of these subsequent actions?
To answer questions like these, you need:
- Hit-level data — not just a table of “total events,” but a list of every individual event, along with columns for the user id, traffic source, device type, browser, and every other dimension that’s available within GA.
- The ability to join this hit-level data with other data sets, such as within your CRM.
Free GA, however, does not allow you to break out of these aggregate tables of data, down to the hit level. And, unless you’re already passing the value of the GA user id cookie to your CRM, it’s not possible to join this CRM data with GA.
Some tools, such as Snowplow, allow you to send hit-level data to your own data warehouse, and therefore are potential alternatives. But, they don’t have GA’s strong out-of-the-box integration with Google Ads, and you’d be starting data collection from scratch instead of leveraging the data you already have.
Relatively low upper limits on features
The free version of GA applies certain limits to your data:
- Hits: You’re violating Google’s Terms of Service if you send more than 10 million hits per month per property. A hit is a single pageview, event, e-commerce transaction, or other request. Especially if you’re using Enhanced E-commerce, which may send a hit for every product on a product listing page, it’s easy to cross the 10-million-threshold even if your total sessions are much lower.
- Custom dimensions: Aside from the data that’s automatically associated with each hit — source/medium, browser, device type, etc. — you can send up to 20 additional dimensions to each GA property. For example, on a product page, you may want to include other attributes with the pageview (color, SKU, size, availability, price). On an article page, you may want to pass the author, publish date, and number of comments. If you’re using third-party data services such as Clearbit, you may want to pass the prospect’s company name, company industry, and company size. And if you’re running split tests, you may want to pass which variants a user saw. With all these options, you can quickly exhaust your 20 custom dimension slots.
- Views per property: We often recommend that clients send all their data to a single web property to get the most holistic picture of user behavior. To see the performance of individual websites or subsections, we then create filtered views within the property. The free version of GA allows up to 200 views per property, which can be limiting if you manage multiple websites across multiple countries.
Rigid funnels
Funnels let you see how people drop off during the path toward a conversion. The free version of GA, however, requires that you specify strict URL paths for these funnels. Newly created funnels are not retroactive, and you can’t apply segments to understand how movement between steps differs for subsets of users.
Why Google Analytics 360
Google Analytics 360 directly addresses these pain points —
Massive unsampled data threshold
Google begins sampling ad hoc queries when the time frame includes more than 100 million sessions, rather than 500,000 sessions. As a result, you can quickly conduct accurate analyses directly in the interface without needing to resort to using sampled data or tools such as Supermetrics.
Complete ad integrations
You can incorporate Campaign Manager, Display & Video 360, and Search Ads 360 into your attribution models, including cost and conversion data. Perhaps most impressively, you can share data back to these systems based on segments you create within GA. For example, you can create a segment of people who came from a particular ad campaign, viewed a product page, and didn’t purchase — then retarget those users. You can also generate lookalike audiences, which target people who have similar attributes to users on your website who’ve — for example — been especially profitable. You can then use this audience list to reach more, yet targeted, people within Google’s ad networks.
Access to raw hit-level data through BigQuery
BigQuery is Google’s cloud data warehouse. GA can be connected to BigQuery, where hit-level data is available. When you purchase Google Analytics 360, 13 months of historic data (or your most recent 10 billion hits, whichever is smaller) becomes available in BigQuery, so you can get started analyzing right away. GA 360 customers also receive a monthly BigQuery pricing credit for their queries.
Increased limits
When you use GA 360, the cap of 10 million monthly hits is removed, and you receive up to 400 views per property. You can also use 200 custom dimensions, instead of 20 — and these dimensions become even more powerful, considering that they’re available on a hit-level basis through BigQuery. This multi-column, hit-scoped data can become the foundation for data science and machine learning applications.
Custom Funnels
360’s Custom Funnels let you create ad hoc, retroactive funnels for in-the-moment analysis. You can also create ad audiences based on these funnel steps (e.g., “people who reached step 3 but not step 4”) and push those audiences to Google’s ad platforms.
Other features
This article isn’t intended to be a comprehensive list of all of 360’s features, and there are many that we won’t get into here, such as: seamless Salesforce integration! Roll-up reporting across properties! Guaranteed data freshness within 4 hours! Improved access to the Google team! While people often decide to purchase 360 for one particular feature, the reality is that a 360 license opens lots of new opportunities.
Other Considerations
It’s easy to get excited about new features that a 360 license enables. But — first, consider whether you’re fully taking advantage of the free feature set. For example:
- Have you configured a custom multi-touch attribution model for inbound sources?
- Are you using this attribution model to continually adjust ad budget toward sources with lowest cost-per-outcome?
- Are you fully using your existing custom dimensions?
- Beyond reviewing dashboards at regular intervals, how often do you conduct custom analyses to make decisions?
- At what frequency are you making substantive changes to improve the user experience? How are you testing and analyzing these changes?
Upgrading to a license
Viget is a Google Marketing Platform Partner. We can provision a GA 360 license for your organization — contact us to discuss if it’s the right choice for you. And, whether you’re using free or 360 GA, we can help make sure you’re getting the most value from the tool, whether that means tracking more complete data, analyzing it effectively, or training your team.
Questions? Please get in touch or leave a comment!