HeatData: A Review
Paul Koch, Former Data & Analytics Director
Article Categories:
Posted on
Most digital analysts know and love click mapping tools such as Clicktale and Crazy Egg, which do a great job of visually displaying users’ clicks on a page. These tools don’t do a great job, however, of showing how user behavior differs on mobile devices. Mobile users can do more than just click: pinch to zoom, swipe, and alter portrait/landscape views, to name a few actions. Recently, we tested out HeatData, a heat mapping tool designed specifically for this type of mobile measurement.
The verdict? Sign up! If you’ll be changing your mobile presence -- especially updating an existing site as opposed to doing a complete overhaul -- it will give you insights you wouldn’t otherwise see. To inspire some ideas on your own site, here are a few insights we saw on Viget.com.
Examples
Viget has a responsive site, so it's important for us to measure different devices to get a complete understanding of site usage. On our homepage, we have a rotating carousel highlighting our clients. To toggle between carousel images, a user must click on the circles toward the bottom of the image -- the same way a person toggles on the desktop site. HeatData, however, showed us that people more commonly swiped on the banners themselves, as opposed to clicking on the circles:
Swipe interactions
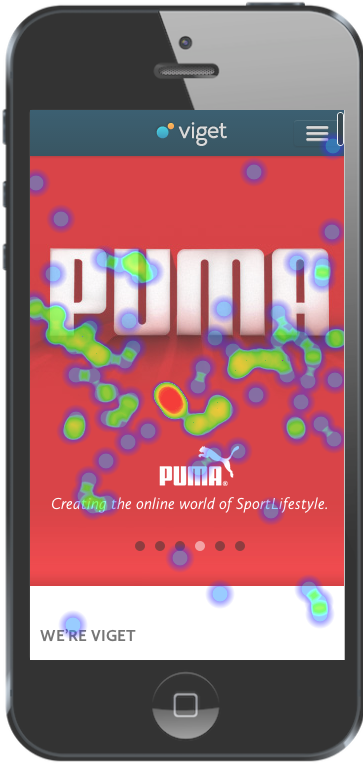
Swiping currently doesn’t advance the banners. Now that we have a better sense of how people expect the site to behave, we can update the site to conform with those expectations, giving people a more intuitive experience.
HeatData also gave us an insight on our "About" page for how we could more closely align with users’ expectations. We noticed that people commonly clicked on the images of our office:
Click interactions
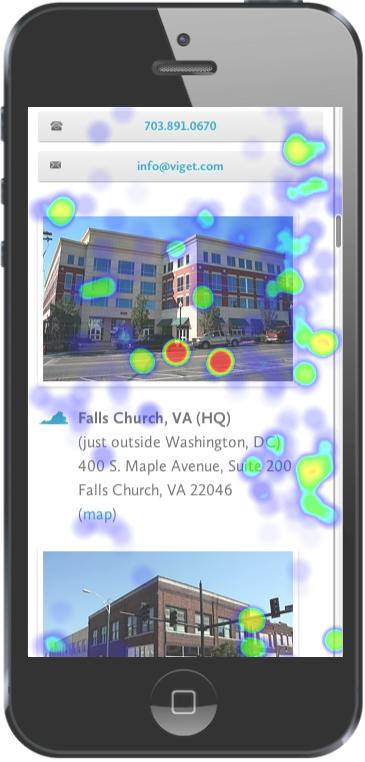
These images are just static. Now that we realize that people expect these to be links, we can update them to point to Google Maps or to each office’s Flickr set.
We have a lot of Google Analytics event tracking on our site -- on essentially every clickable element -- but this event tracking doesn’t tell us what elements should be clickable. The visualizations above give us a much better sense of how the site can be more intuitive, in ways we’d never even considered tracking previously.
Downsides
While the data’s good, the UI is a little clunky. HeatData displays no visual difference between particular interactions, so each report really only works if you’re examining a single type of interaction:
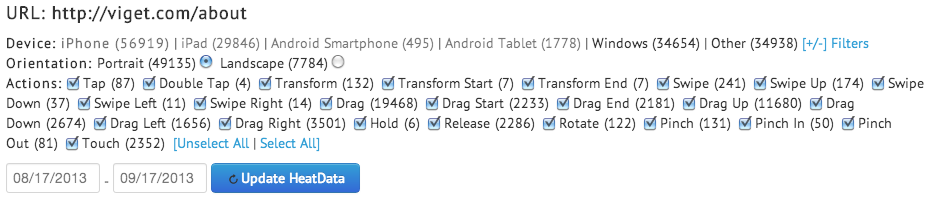
The dashboard is sorted alphabetically rather than by most-viewed page, meaning you have to manually search for each page of your site. It’s not possible to sort by the pages with the most, or fewest, interactions. (Our dashboard’s entire first-page was a list of files downloaded and opened locally on users’ machines.) The interface can also be slow.
Pricing
At $99 per month for the 250,000 visitor tier, HeatData’s pricing is identical to Crazy Egg’s, and less expensive than Clicktale’s (which costs about $300 per month for 80,000 pageviews). As an additional side benefit, HeatData offers monthly pricing, compared to annual commitments typically required from Clicktale.
Summary
Ultimately, the data in your reports outweighs the suboptimal interface by a long shot, and we’ve added this product to our shortlist of analytics tools.
What new analytics products have you been trying lately? Should we know about any others? How are you optimizing your mobile or responsive site? Feel free to contact us or comment if you're interested in learning more about mobile analytics and heat mapping.