Visualize Traffic Data on Site Maps Using Google Analytics and Omnigraffle
Paul Koch, Former Data & Analytics Director
Article Categories:
Posted on
Two of our greatest loves at Viget are information architecture and analytics data -- but, it can be a challenge to easily visualize both at the same time. A crucial part of re-architecting a site involves understanding which buried, but high-trafficked, pages could be better bubbled up and which prominent, but less-popular, pages could be de-prioritized. Google Analytics does a great job showing your top pages, but what about your not-top pages?
On a recent project, KV, Eli, and I created a process for colorizing Omnigraffle site maps based on the number of views a page received or based on the date the page was last modified. Download the template here and try it for yourself! Note that this only works for Macs.
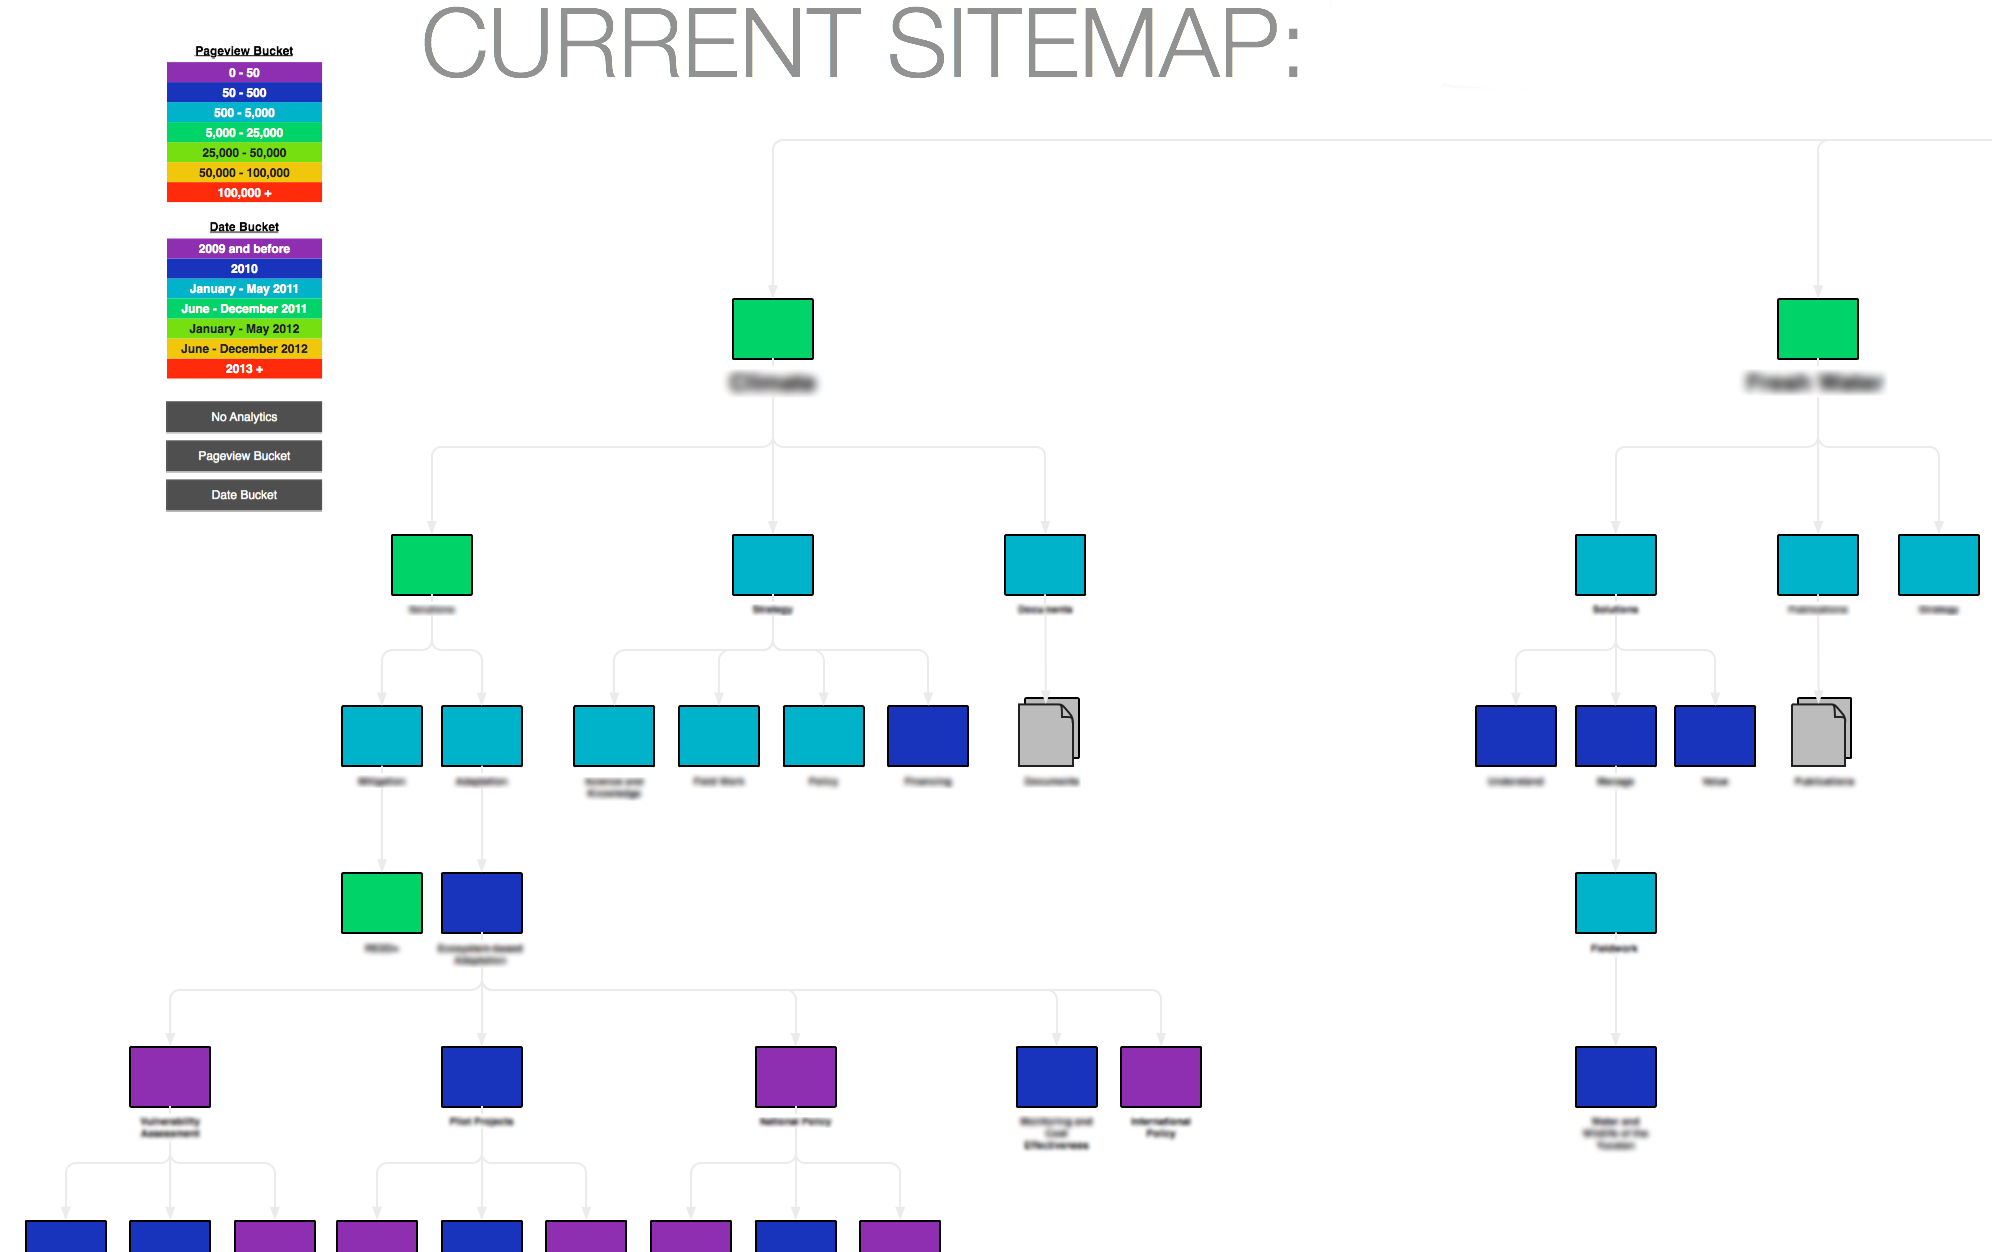
A final product looks like this:
In summary, you pick ranges for individual colors:
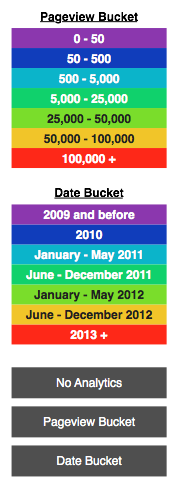
then hold down the “B” button in Omnigraffle and click either the grey “Pageview Bucket” or “Date Bucket” buttons. All the individual pages will then fill with the appropriate color.
Here’s the complete process we use for making this as speedy as possible:
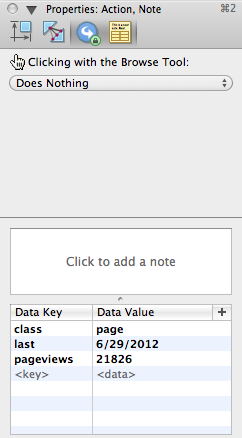
1) As you’re building your site map, ensure each of your page objects includes three Data Keys: class, last, and pageviews. You can add these by opening the Omnigraffle Inspector and navigating to Properties > Note.
2) Copy and paste the colorized buckets and grey buttons from the template onto your canvas.
3) Use your standard analytics tool to pull pageview data for each individual page. I typically automate this by finding a client’s XML site map, pasting it into a Google Spreadsheet column, and using the Google Script that Mitch describes here to automatically pull data for each individual URL.
4) Here comes the manual component: copy and paste each of those pageview values from the Google Spreadsheet (or your own analytics tool) into the associated pageviews Data Value for each page in the site map.
5) Click on the grey “Pageview Bucket” button and open the Inspector. Navigate to Properties > Options. You’ll see a script that looks like this:

6) Copy and paste this script into a text editor and edit the if-statements to fit the ranges that make sense for your project:
 repeat with colorScale in (every solid of every group of canvas of front window where value of user data item "class" is "pageviewBucket")
if value of user data item "id" of colorScale is "scaleOne" then set colorOne to fill color of colorScale
if value of user data item "id" of colorScale is "scaleTwo" then set colorTwo to fill color of colorScale
if value of user data item "id" of colorScale is "scaleThree" then set colorThree to fill color of colorScale
if value of user data item "id" of colorScale is "scaleFour" then set colorFour to fill color of colorScale
if value of user data item "id" of colorScale is "scaleFive" then set colorFive to fill color of colorScale
if value of user data item "id" of colorScale is "scaleSix" then set colorSix to fill color of colorScale
if value of user data item "id" of colorScale is "scaleSeven" then set colorSeven to fill color of colorScale
end repeat

repeat with thePage in (every solid of canvas of front window where value of user data item "class" is "page")
set fill of thePage to solid fill
set fill color of thePage to {1, 1, 1}
set currentPageviews to value of user data item "pageviews" of thePage as number
if currentPageviews < 50 then set fill color of thePage to colorOne
if currentPageviews > 49 and currentPageviews < 500 then set fill color of thePage to colorTwo
if currentPageviews > 499 and currentPageviews < 5000 then set fill color of thePage to colorThree
if currentPageviews > 4999 and currentPageviews < 25000 then set fill color of thePage to colorFour
if currentPageviews > 24999 and currentPageviews < 50000 then set fill color of thePage to colorFive
if currentPageviews > 49999 and currentPageviews < 100000 then set fill color of thePage to colorSix
if currentPageviews > 99999 then set fill color of thePage to colorSeven
end repeat

repeat with thePage in (every solid of canvas of front window where value of user data item "class" is "noPageviews")
set fill color of thePage to {0.683673, 0.683673, 0.683673}
end repeat
7) Replace the current script with your updated script. Hold down “B” and click the “Pageview Bucket” button to see it in action!
8) Repeat this process with last-modified data if you have it. The resulting visualization will likely show you sections of the site that haven’t been updated in years, versus the parts that have seen continual updates. If you want to add more or fewer colors to either scale, you can build on the code -- just make sure the new buckets of color you add have a class of pageviewBucket and an associated id that follows the format of the other blocks of color.
9) Bask.
While building the visualization does take some legwork, we’ve found that it’s usually worth the investment. As new questions and decisions come up during the course of the project, the project team can refer back to the document and easily continue drawing conclusions. Hope you find it helpful!