A Dive into the World Cup’s Data
Solomon Goldfarb, Former Data & Analytics Intern
Article Categories:
Posted on
The World Cup offers joy and heartbreak, heroism and villainy, and best of all -- tons of data. Why you shouldn't trust FIFA's rankings, how playing physical might level the playing field, and which continents dominate international soccer.
Why the World Cup is Awesome
As an avid soccer fan, I’m having a lot of conversations this summer with people who are paying attention to soccer for the first time in four years — and I couldn’t be happier about it. I love these few weeks when everyone has a favorite team or player on soccer’s grandest stage. There’s no dance group I’d rather watch than the Senegalese squad at the corner flag, and there’s no better celebration across cultures than when Mexican fans hoisted the South Korean ambassador around Mexico City in gratitude for helping Mexico advance to the next round. The World Cup is an opportunity to watch far-flung styles clash, such as the creativity and patience of Spain probing the well-drilled Iranian defense, or the supremely talented German squad getting stunned by the high-octane Mexican counter-attack.
In this article, I’ll analyze data harvested from this and past years’ World Cups. Some of the data might confirm what your eyes tell you, and some might surprise you. With that, let’s kick off!
Why You Shouldn’t Trust FIFA Rankings, and How SPI Compares
The official international team rankings are calculated by FIFA and released (in typical FIFA fashion) as the FIFA/Coca-Cola World Rankings. Their system is transparent — points are earned by beating or drawing other teams, and the number of points at stake in each match depends on the importance of the match, the strength of the two teams, and a multiplier for each confederation. Relying on an objective system is all well and good, but the actual output often fails the sniff test for those who have watched the teams play. For example, one-dimensional Poland (8) sits ahead of powerhouses Spain (10) and Uruguay (14). Chile (9) and the Netherlands (17) watched from home as their confederations were represented by Colombia (16) and Serbia (34), respectively. Meanwhile, Russia lurks down at 70th overall thanks to their exemption from qualifiers as host nation, which FIFA fails to take into account.
Luckily, Nate Silver’s FiveThirtyEight has constructed a Soccer Power Index (SPI) for international predictions. Their methodology takes into account in-depth metrics from past results, such as the expected number of goals scored and allowed. It also accounts for the strength of each team’s roster using data collected from players’ performances during the year’s club season. These detailed measurements result in a much more informed ranking system, which begets provably better results. I analyzed how well these SPI scores have predicted the tournament results so far compared to the FIFA rankings.
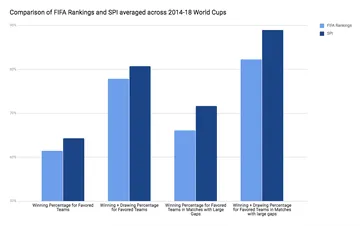
In the 2018 group stage, the teams favored by the FIFA rankings won only 54% of their matches and lost 27%. The teams favored according to SPI, however, won nearly 65% of their matches and lost fewer than 17%. In 2014, the FIFA rankings fared better, actually beating the SPI predictions by about 5%1. SPI really outshone the FIFA rankings, however, in games with a “large gap”2 between the rankings of the two teams. In both 2014 and 2018, SPI’s heavy favorites won more and lost less: 6% and 7%, respectively, over the two tournaments. In the 63 games that SPI would have called “locks,” their favorites went 50-6-73 , whereas the FIFA favorites went 41-10-11 in the equivalent 62 games with heavy favorites.4
How Fouls Affect the Game, and Implications for Underdogs
How do teams try to even the scales when outmatched on talent or experience? One way is playing more physically — fouling early and often to stop potentially dangerous attacks and to prevent the other team’s stars from finding a rhythm. These fouls are often attempts to stop elite players by any means necessary. The three most fouled players of the 2018 World Cup, as of the round of 16, were Neymar (23 fouls drawn), Lionel Messi (15), and Cristiano Ronaldo (14). These were the top three vote-getters for the 2017 Ballon d’Or, awarded to the best player in the world. Strategic fouling can slow down the game and frustrate opponents who might rely on quick passing to break down tight defensive structures.
At a quick glance, one might conclude that this strategy hurts the teams that employ it: in 2018, only 31% of games were won by the team that fouled more5, and that figure was as only 20% in 2014. The lower-ranked team won or drew 35% of the matches in which they fouled more in 2018, the same win rate for underdogs throughout the tournament. In 2014, however, underdogs won or drew 45% of the matches in which they fouled more, compared to their 36% clip in the tournament overall. These figures indicate that committing more fouls than an opponent may not win a team the match, but it might at least even the playing field a little bit.
One reason why fouling may help underdogs: FiveThirtyEight confirmed the traditional wisdom that referees rarely award enough stoppage time — so by committing an excessive number of fouls, lower-ranked teams can actually shorten a match. Through the first 32 matches of the 2018 group stage, there was a -0.43 correlation between the number of minutes the ball was in play and the number of fouls committed in the match. The less time to play, the less likely the law of averages will begin to favor the better team.
What Confederation Matchups tell us about European and South American Dominance
Every FIFA recognized national team is a member of one of 6 confederations that more or less mirror the continents. African teams play in CAF, North and Central America have CONCACAF, South America has CONMEBOL, Oceania has OFC, Asia and the Middle East have AFC, and Europe has UEFA. OFC has not had a representative qualify for a World Cup since 2010, as their top team, New Zealand, is ranked 120th in the world6 . UEFA and CONMEBOL tend to dominate the international scene, claiming 19 of the top 20 spots in FIFA’s world rankings7 and all of the top 10. No nation from outside Europe or South America has ever won a World Cup. 2018 has given us our fourth consecutive European victor. All 2018 quarter-finalists were from either CONMEBOL or UEFA, and in 2014, only CONCACAF’s Costa Rica managed to crash the party.

Of the 12 Confederational matchups that occurred at least once at the 2018 or 2014 World Cups, only one saw the teams favored by SPI win less than half their games. Apparently when an African team plays an Asian team, anything can happen: the favored team has won only one of the six matchups between the two confederations.
When it comes to, ahem, chippiness, the Americas are unmatched. The 6 matchups with the highest average cards per match all involved either CONCACAF or CONMEBOL. The only matchups exceeding 30 fouls per game were CONMEBOL vs. UEFA, CONCACAF vs. AFC, and of course matches between two CONMEBOL sides. For comparison’s sake, matches among UEFA opponents featured an average of only 2.6 cards and 24 fouls. Love for thy neighbors seems to be sorely lacking west of the Atlantic.

Conclusion
The data tells us that the favored teams tend to win their games, as long as we’re listening to the right ranking system to know who should be favored. Underdogs can’t be counted out, however, and may foul aggressively to slow down the match and level the playing field. Expect to hear lots of whistles and see lots of cards when CONCACAF and CONMEBOL teams take the field, while you might be in for a more subdued match if you’re watching UEFA representatives. Whether you’re celebrating or mourning France’s win — and the fact that the next World Cup is four years away — there is plenty more beautiful fútbol (and data) to tide us over until then.
1: 2014 was the first year that FiveThirtyEight started tracking SPI.
2: I picked a somewhat arbitrary difference of 10 FIFA ranking spots or 9 SPI points, which gave roughly the same number of games in the category for both systems.
3: Win-draw-loss format
4: Chart starts at 50%, which is the baseline as you’d expect “random” rankings to predict the winner of 50% of games correctly
5: Of the games which did not end in a draw.
6: Australia left OFC and joined AFC in 2006, largely in search of stiffer competition at both the club and international levels.
7: Mexico is ranked 15th.