Optimizing Advertising Using Google Analytics Attribution Modeling and Excel Solver

Paul Koch, Former Data & Analytics Director
Article Categories:
Posted on
Shift budget to your most cost-effective marketing while understanding the ripple effects throughout your spend.
As your digital marketing program becomes more sophisticated and your marketing mix more diverse, decisions become harder. Because more variables drive your outcomes, it can be challenging to understand how one decision ripples through your entire marketing spend.
Ultimately, though, your goal is simple: shift your spend toward the most cost-effective sources as you minimize your cost per conversion. Doing so will maximize total conversions, even while your budget stays constant.
This article will focus on two fantastic tools to help you avoid analysis paralysis:
- Google Analytics attribution modeling
- Excel Solver add-on
You’ll apply these tools to understand how to shift your paid advertising budget. The post assumes that you’re already comprehensively tagging your paid marketing with UTM parameters and have goals correctly configured — so if you’re not, start there first.
Google Analytics Attribution Modeling
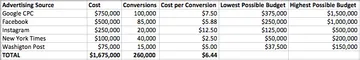
Most Google Analytics reports, such as the Source/Medium report, give a list of inbound sources and their goal completions. For example:
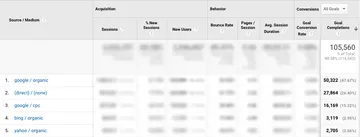
This data, however, presents an overly simplistic view of how people behave on the website. What happens if someone interacts with three different inbound sources before converting? Should the first awareness-driving source receive credit? What about the last deal-closing source? Or, should credit be applied equally to all sources?
In most reports, Google Analytics follows the “last non-Direct click” model. This means that the last source receives credit for the conversion, unless that source was a Direct session — in that case, the last non-Direct source receives credit for the conversion.
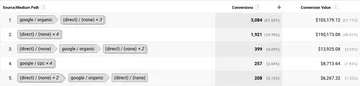
This model leaves you with lots of blind spots. Take a look at your Top Conversion Paths report (Conversions > Multi-Channel Funnels > Top Conversion Paths > Source/Medium Path) to see how complicated most users’ inbound source interactions are:
Instead of using the last non-Direct click model shown in most reports, you should consider using Google Analytics’ Attribution model reports, which paint a more accurate picture of user behavior. You can access these reports under Conversions > Attribution > Model Comparison Tool > Source/Medium. Rather than a single source receiving full credit for a particular conversion, you can assign partial credit and choose the model by which this credit is assigned:
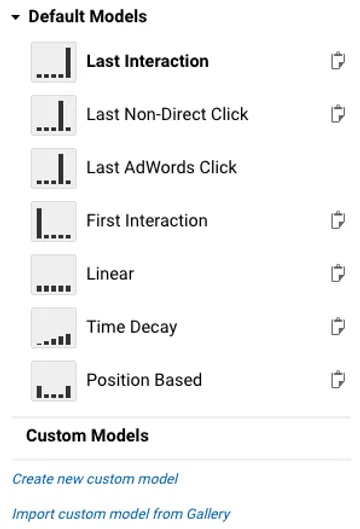
You can see in the visual above how credit is assigned for each model. For example, under a First Interaction model, only the first source receives credit for a conversion. This approach can be helpful when your advertising mainly focuses on driving new awareness. Linear applies equal credit to all sources. If a user interacted with three sources before converting, each source receives 1/3 credit for the conversion. If a user interacted with five sources, each source receives credit for 1/5. If two of those five sources were the same, then that source would receive 2/5 credit.
If you need to fine-tune these approaches further, you can click “Create New Custom Model” to build your own. Often, we use a model that applies a Linear method, but that excludes Direct traffic from receiving credit. That way, if a user interacted with two advertising sources and returned directly eight times, then each advertising source receives 1/2 credit for the conversion, rather than 1/10 of the the credit.
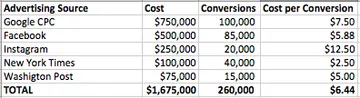
In the Attribution report, run a filter search to include all of your paid advertising, and export the data to Excel using the Google Analytics “Export” link. If your cost data isn’t included in Google Analytics, add it directly to the Excel sheet. You should have something that looks like this (though likely a much longer list):
Using Excel and Solver
Now, let’s add in a few more lines to the Excel sheet. You’ll need to define how much and how little you’re willing to spend on the source in the future. You could custom-define these for each source; in this example, we’ll apply a consistent multiplier of “as low as half — and as high as twice — the current spend.”
Lastly, let’s add two final columns: “Solved Budget” and “Solved Conversions” —
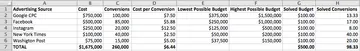
In the “Solved Budget,” type in any placeholder value for now. In “Solved Conversions,” divide the “Solved Budget” by “Cost per Conversion.” This column will show you how many conversions you should expect with a given Solved Budget. Add a sum at the bottom of these columns.
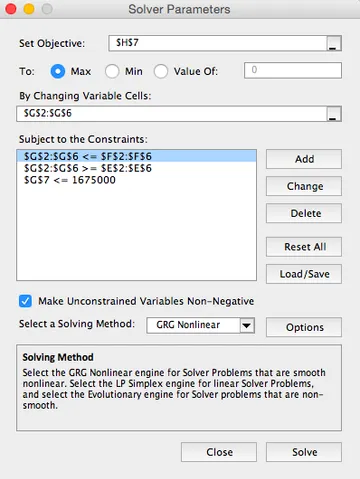
Make sure you have Solver installed as an Excel add-on. Now, it’s time for the fun part. We’ll set up Solver to create a Solved Budget for us that maximizes Solved Conversions. Solver lets you maximize a cell (H7, Total Solved Conversions) by changing a set of variables (Column G, Solved Budget) based on a set of constraints (the total Solved Budget must be no more than X, and each individual Solved Budget row must be no lower than its associated Lowest Possible Budget and no more than its Highest Possible Budget). This is how those parameters look in Solver:
Once we Solve, our Solved Budget and Solved Conversions change:
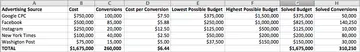
Solver recommends that we increase our New York Times budget to its “Highest Possible Budget” of $200,000, because that source has the lowest Cost per Conversion. It takes that money from Instagram, which has the highest Cost per Conversion. Solver continues to take budget from Instagram until it hits its Lowest Possible Budget. It continues to take budget from under-performing sources and give it to over-performing sources until budget has been efficiently redistributed. You can see that for the same budget ($1,675,000), we are expecting 19% more conversions (310,250 vs. 260,000).
Using GA Attribution Modeling and Solver, we can easily understand where we should shift our budget to maximize our outcomes.
The Necessary Caveats
Keep three caveats in mind:
- Past performance does not necessarily predict future performance. You can reassign budget based on past performance, but you shouldn’t expect to realize all of the possible gains. Future cost per conversion will inevitably be different, and you’ll likely see your total conversions fall somewhere between what’s existing (260,000) and what Solver suggests you’ll get in a perfect world (310,250).
- Often, clients care about optimizing more than just one conversion at the same time, understanding the interplay between the different conversions, and building in additional assumptions to the model. While out of the scope of this blog post, they’re reasons why clients hire Viget to handle work like this instead of analyzing their marketing themselves.
- If your organization is especially large, tools such as Attribution 360 do what’s described in this post in an even larger and at-scale way. But, even if you’re not at the 360-purchasing size, you can still make smart decisions about your media spend.
We hope this article helps you make better decisions! Please comment if you have any questions.