How to Visualize Your Site as a Treemap
Todd Moy, Former Senior User Experience Designer
Article Categories:
Posted on
Early into a content audit a few weeks ago, I wanted to visualize the website in conjunction with pageview data. I suspected that the site had a few isolated hotspots of activity and some large dormant areas, but I wanted more certainty. I also wanted a visceral sense of where the content lived and what was important.
So, my questions were simple:
- Which sections and subsections comprise the majority of the site?
- Which sections are visited most often?
To answer these, I wanted an efficient way to get at this data. I soon discovered that I could produce a useful visual quickly using Google Spreadsheets' support for Treemaps.
After playing around with this, the tool seemed reusable and I cleaned it up for others. Here's how you can create one.
Getting and populating the template
First, you'll need to make a copy of the template from Google Drive. You'll need a Google Apps account, naturally.
Once you have that, you'll need to replace the list of pages with your own. In this example, each page has:
- Page title
- Page URL
- Pageviews (or some other metric)
Note: Technically, you don't need Page URL since it's only used for reference. But I find it helpful to have around.
Getting data will be the hardest part of this exercise. Depending on your access to the technology that powers the site, this may be readily available or not.
For me, I turned to a sitemap.xml file because it contained two bits of data I cared about: the page title and the URL. This file is easily produced by many CMSes, Google Webmaster Tools, or an external site spider. All I had to do was extract the relevant information, which I did using Google Refine.
Getting metric data will depend on what you're interested in. Page-level analytics like time on page, bounce percentage, and repeat visits are easily attainable from Google Analytics. Your CMS may provide other insightful information such as days since last update.
Paste that info into columns A, C, and D on the Raw Data tab.
Grouping the data

In its raw form, a list of pages isn't terribly useful. So, we need to group the pages. These groups become the blocks in the treemap; the number of pages in each determines their size. These groups can be anything you care about. Here, I'm grouping pages by subdirectory, but other grouping strategies could be:
- By author
- By audience
- By template type
- By nav section
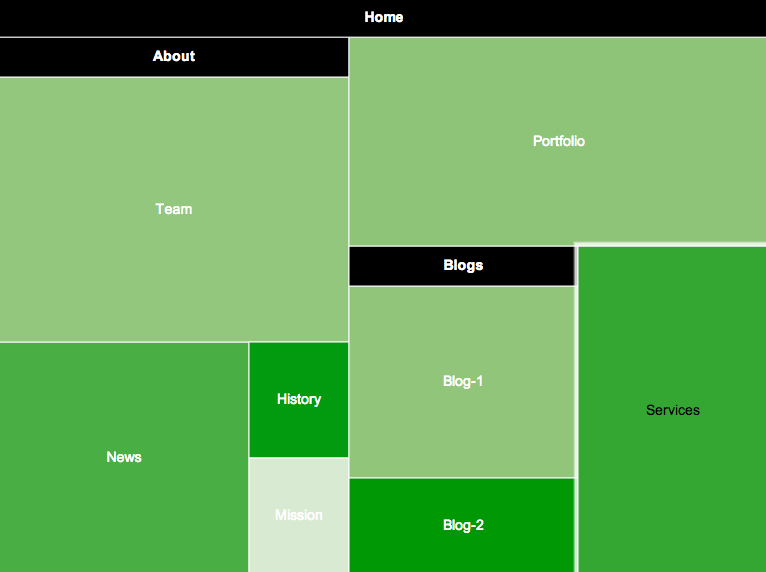
Don't worry about the entire hierarchy of groups at this point. Right now, focus only on the nearest grouping that you'd want to appear as a block. For example:
 example.com/about/team/karen/ → Team
example.com/about/team/will/ → Team
If you have any one-off pages that you want to force to show up as a block, add them to their own group.
 example.com/about/history/ → History
example.com/about/mission/ → Mission
Tallying the data
Now that the pages are grouped, you'll need to aggregate the data and present it in a table that's understandable to the Treemap. On the Tallies tab, you'll see the data is arranged in the following way:

In Column A, you need to list every unique group you created on the Raw Data tab. Column B is where you create the hierarchy of groups. For each group (except the first) you need to identify its parent. Each parent must match the name of a group in Column A exactly. Everything must ultimately roll up to one group – in this case, "Home."
You can nest groups as deep as you'd like. For example, if you wanted this nesting...
Home / Blogs / Blog-1
...you'd enter the data like so...
 Home
Blogs → Home
Blog-1 → Blogs
As you add groups, Pages per Group and Average Page Views should update automatically. If you're using a different metric than pageviews, you may need to adjust the formula in Column D. It's currently set to average data for all items within a group.
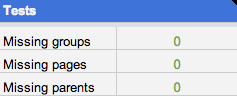
You can check your progress in the Tests table on the right. When all items are zeroed out, you're done.
Viewing and Customizing
Jump over to the Treemap tab to see your creation. If you nested the groups, you can navigate down a level by clicking the blocks and headings. Going up a level isn't as obvious – you right-click the topmost heading.
Once your data is presented as you expect, it's worth exploring options under the "Advanced edit..." button. Here, you can change the color scheme and adjust the number of levels of hierarchy shown.
That's all folks. If you have questions or additional thoughts, drop 'em in the comments.